KoBotoolbox
KoBotoolbox is a tool desoigned for the sole purpose of data collection.
Features of KoBotoolbox
-
Form builder
-
Allows you to design forms more quickly and with ease using their formbuilder
- Reuse existing questions and blocks of questions and manage them in the question library
- Build complex forms with skip logic and validation
- More than 20 different question types available including location, image, video, rating, matrix, etc.
- Easily share projects with colleagues and set granular permission levels
-
Import and export XLSForms Import via URL or upload from your computer
-
Collect Data
- Online and Offline
- On phones, tablets or any browser Using KoBoCollect on Android devices and Enketo on any modern browser
- Synchronize data via SSL Ensures data can't be read by a third party
- Strong safeguards against data loss Even on very long interviews
- Data immediately available right after it's collected
-
Analyze and Manage Data
- Create summary reports with graphs and tables and fine-tune your report's charts, colors and questions
- Visualize collected data on a map includes a heatmap, clustering, other base layers, etc.
- Disaggregate data in reports and mapsi.e. by gender, region or educational level
- Export all your data at any time Supported formats: Excel, CSV, KML, ZIP (for media) and SPSS
- Access your data through our robust API
Mapping, Sharing, and Exporting GPS Data
KoboToolbox includes the GPS data (latitude, longitude, altitude, precision) in the dataset that can be downloaded as XLS or CSV. It is also possible to view the GPS coordinates on an online map and to download the points as a KML file for use in other applications.
Viewing the gps points
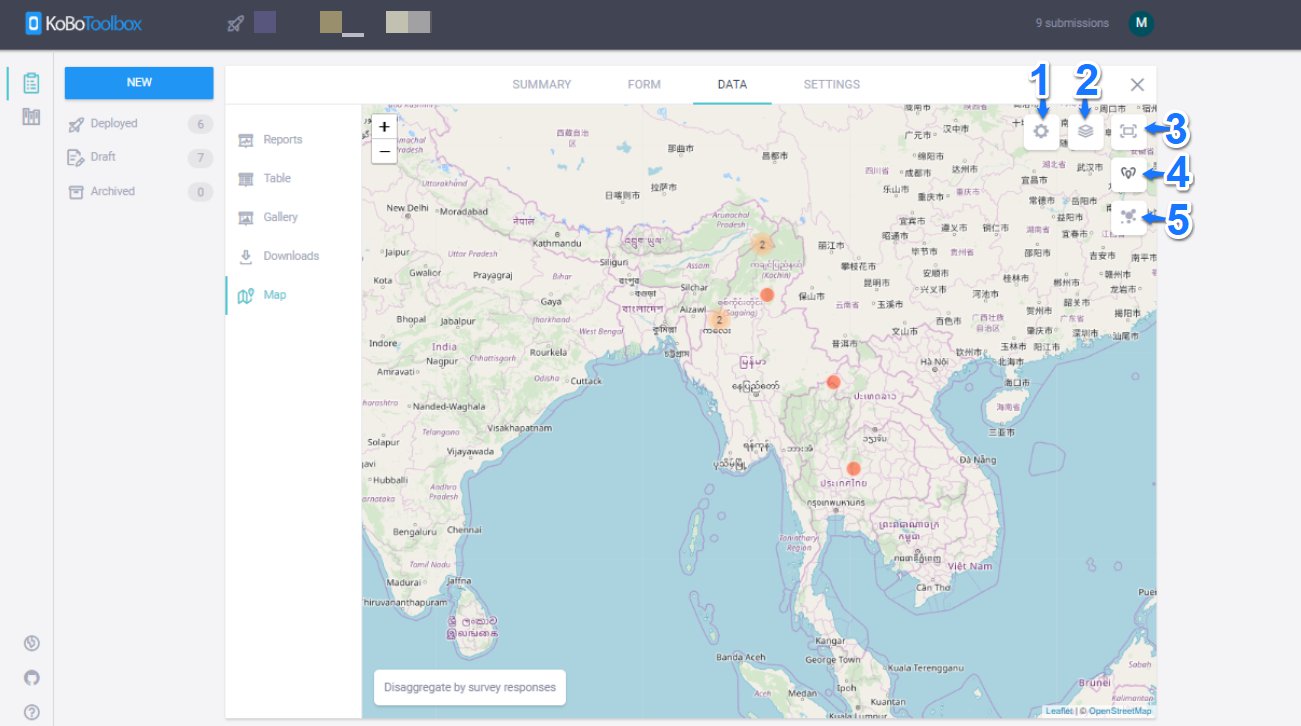
- View GPS points online
Click on the button View on Map, which leads to the online map view. This visualization also allows to see the submissions based on certain question responses. When viewing your data on a map, you can also disaggregate by question responses, such as displaying male and female respondents, or other types of responses where a simple geographic distribution might be interesting The full list of current map features are below:
- Settings: Upload data overlays and choose marker color schemes.
- Toggle layers: Toggle through multiple map background options.
- Toggle fullscreen
- Show data as points (default)
-
Show data as heat map
-
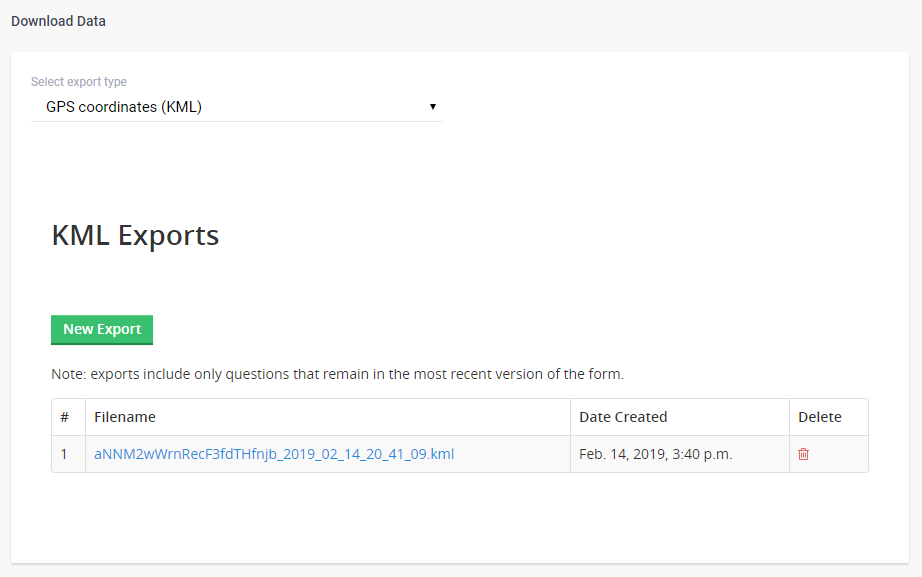
Download GPS points as KML.
Click on the button Download GPS Points. This will start a new export process with the latest data.
Previous exports will be listed by their creation date, allowing you do see snapshots of GPS coordinates at various points in time.
KML files can be imported in a variety of software, including Google Earth, Google Maps, or professional GIS software, such as ArcMap.
- Export data as CSV and upload to GIS software
As an alternative to exporting your GPS data as a KML file, its possible and easy to export and upload your data as a CSV file (which will include all attributes) directly into GIS software as a shapefile
How to share map data
You can share a map with others is to go into your Project’s Settings and enable Share Data. This means that anyone can view your data - i.e. in map, table, or file download format. They won’t be able to edit anything, which would require giving Can Edit permissions to a particular user. After this you can send the URL of the map.
Viewing and Creating Custom Reports
On the Reports page in the Data section of your project, you can create and configure multiple summary reports with custom graphs, tables, and color schemes. The custom reports are shareable by either printing, saving as a PDF, or storing them on an external cloud service.
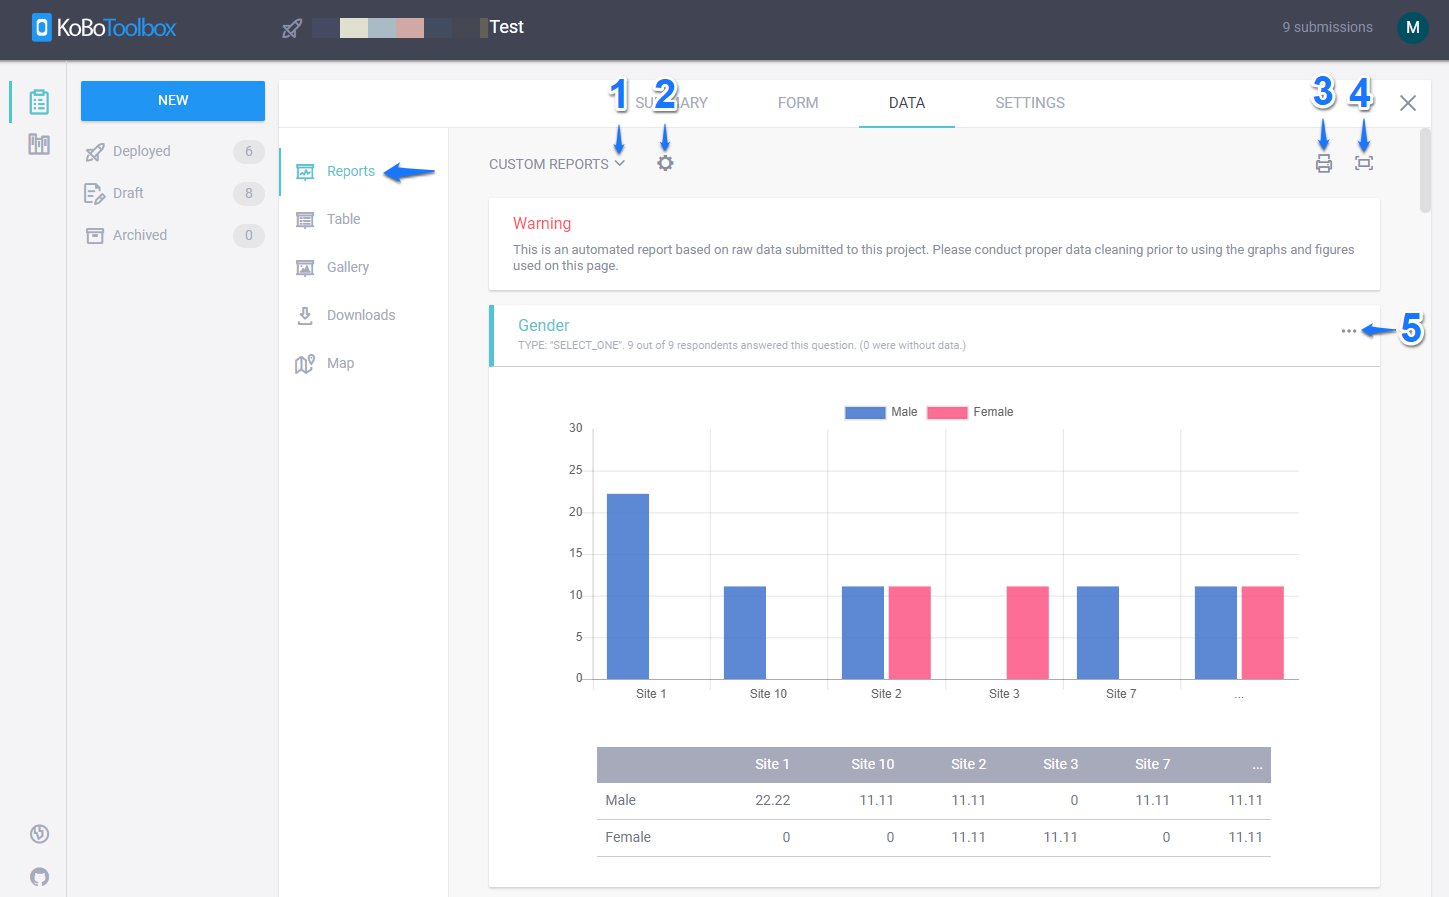
- Custom Reports
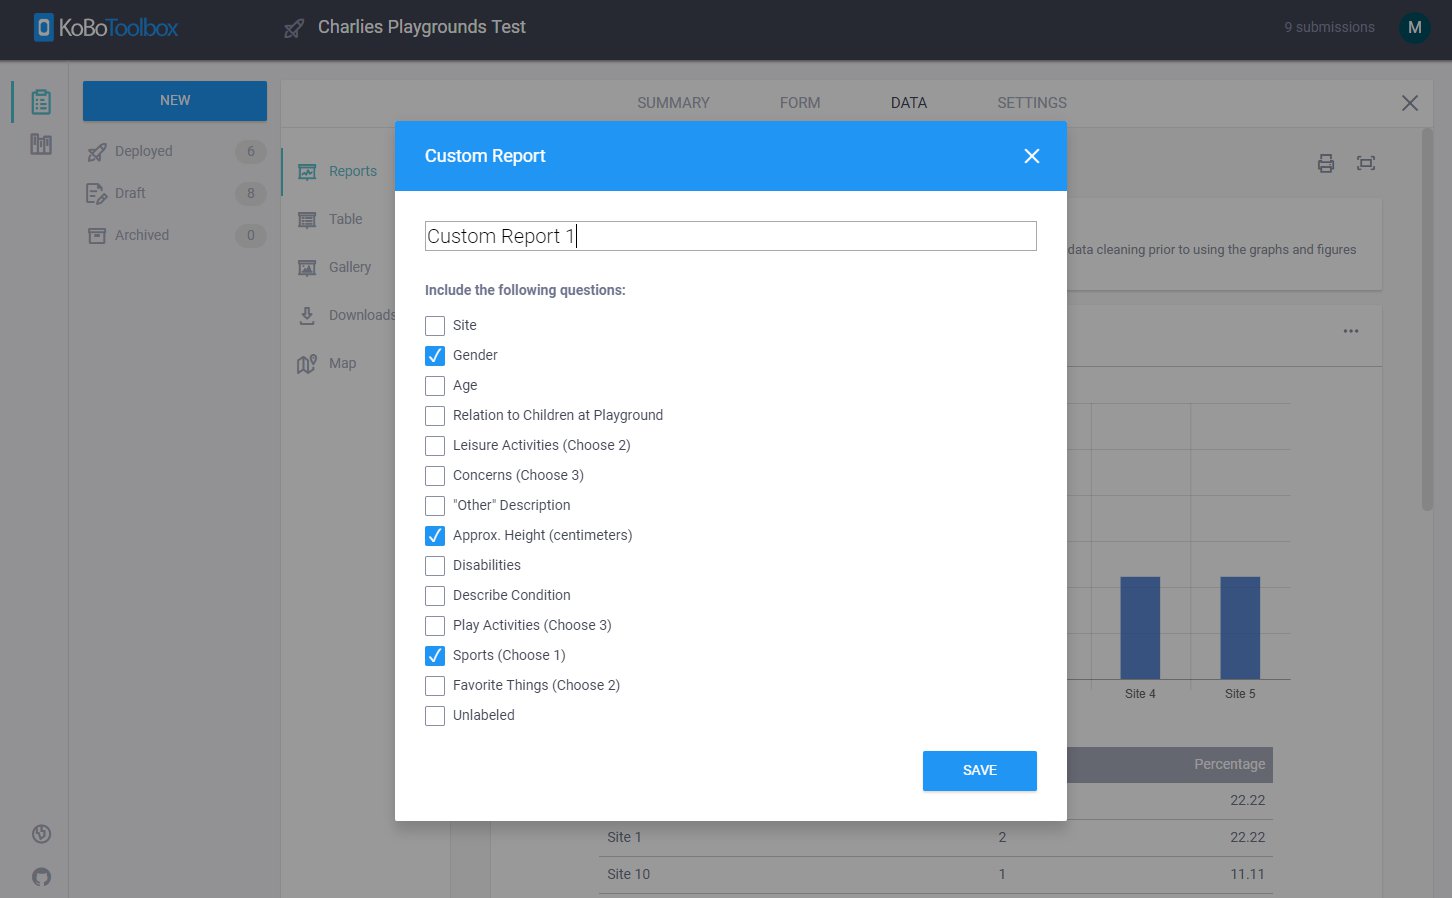
The CUSTOM REPORTS allow you to view the Default Report based on the dataset available in your survey project. It also allows you to Create New Report (by giving it a unique title and selecting which questions to include or exclude) or search through previously created custom reports.
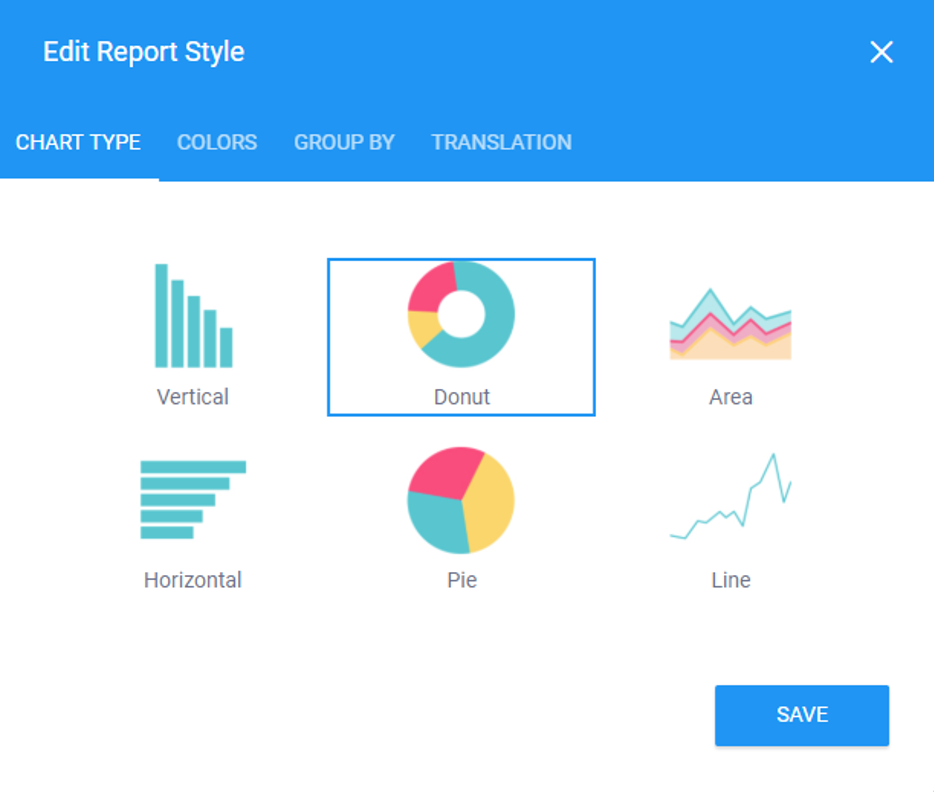
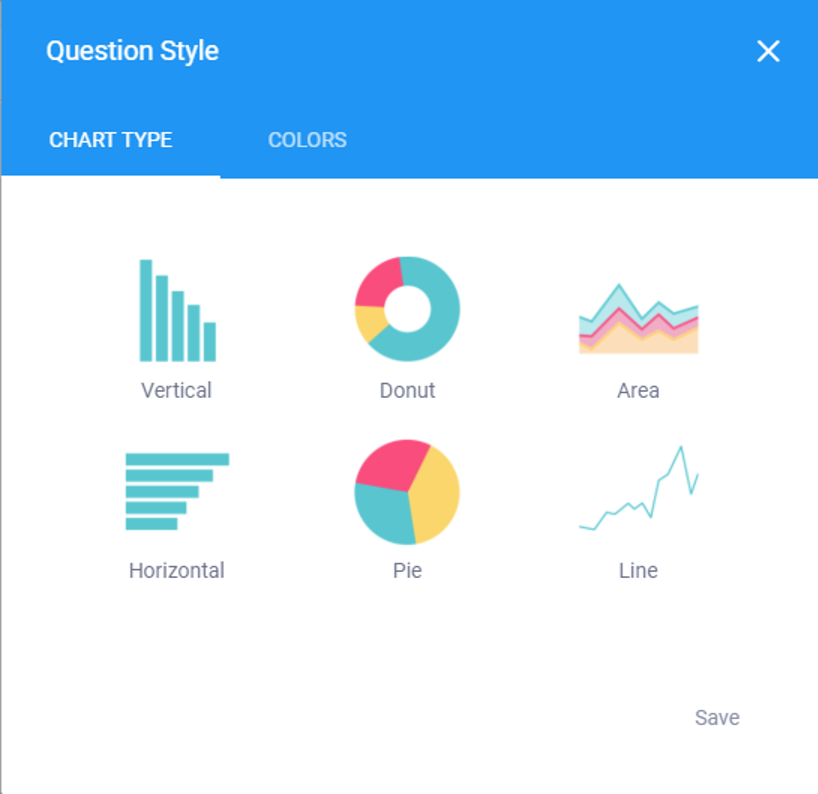
- Edit Report Style
The Edit Report Style button allows you to change the CHART TYPE to Vertical, Donut, Area, Horizontal, Pie and Line.
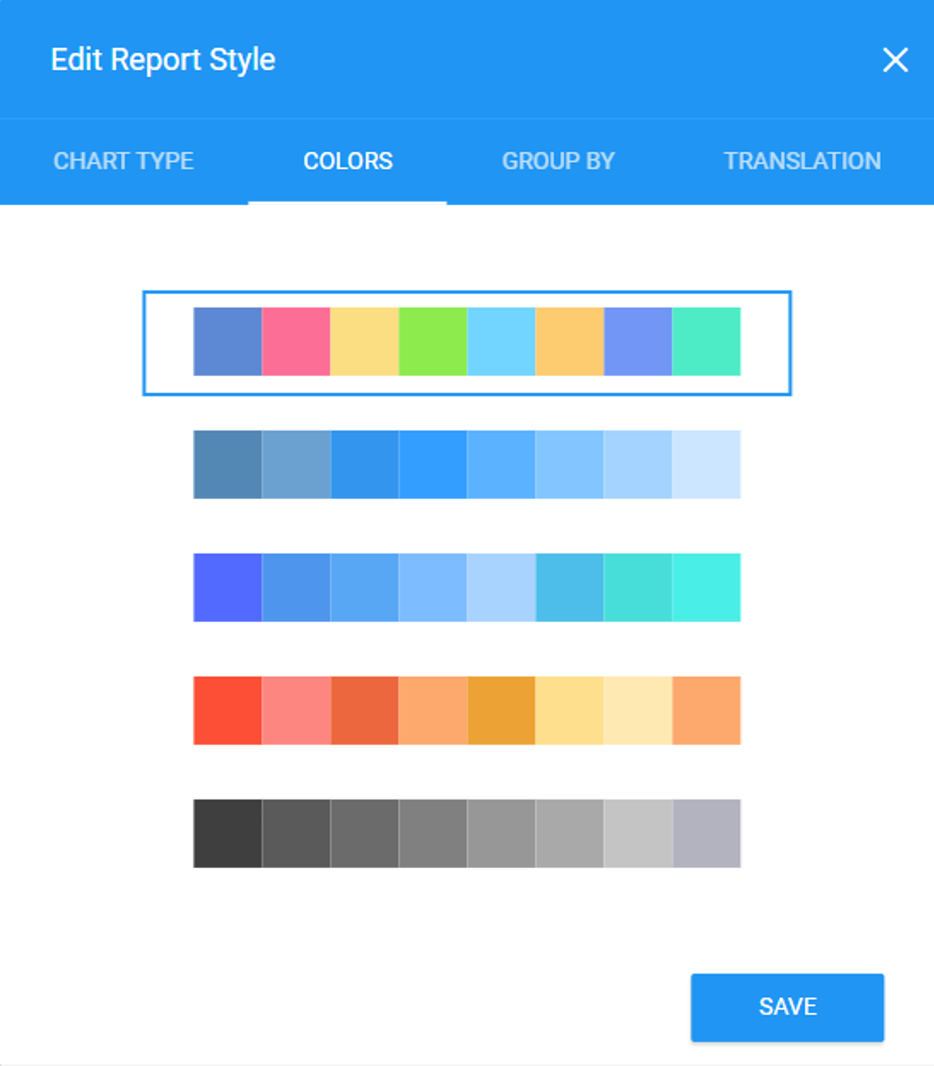
It also allows you to choose different COLORS for your charts.
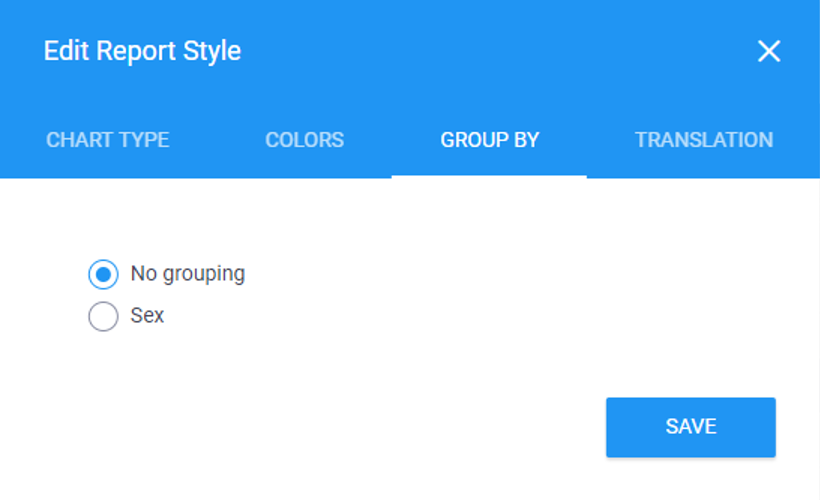
You can also group the charts by different categorical variables available in your dataset by selecting GROUP BY and selecting a variable from the provided list. Please note: If a variable has more than 5 choices, KoboToolbox would create a chart displaying only 5 choices lumping the rest together as …
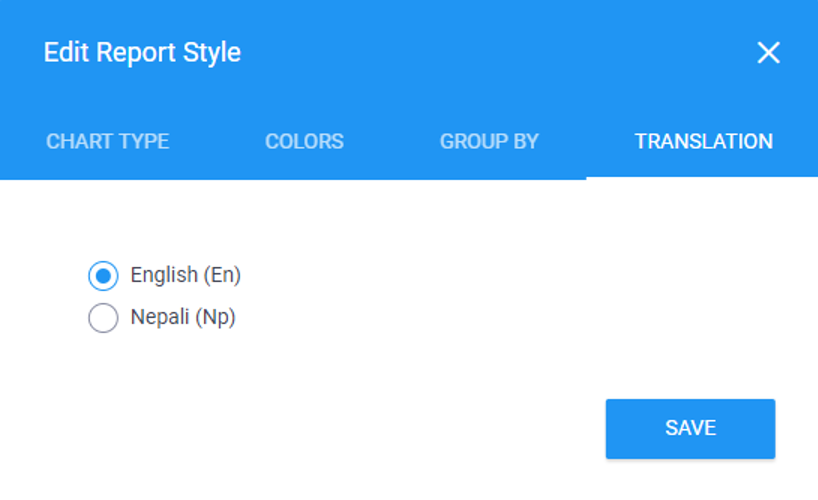
Or you could also change the label of your charts to different languages available on your survey project by selecting TRANSLATION. (This tab will only appear if you have multiple languages in your survey project)
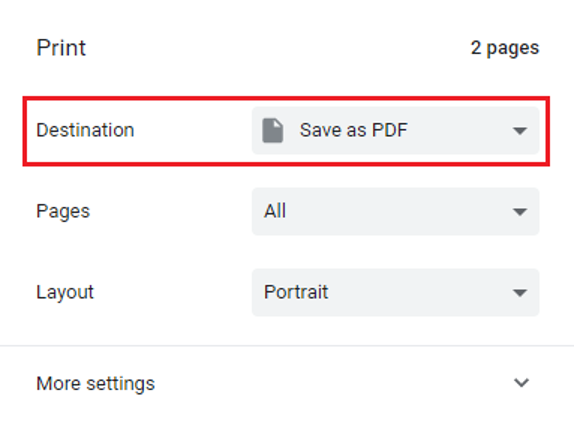
- Print You could also print the custom report by clicking the Print icon or save it as PDF by selecting Save as PDF under Destination.
- Toggle full screen
You could Press Toggle full screen to view the custom reports in a full screen or press back the Toggle full screen to view it to in a normal mode.
- Override Graph Style
You could click the Override Graph Style (3 dot icon) to customize the CHART TYPE and COLORS of the chart for each variables (questions) within your custom reports. This will override the graph style (for a question) that has been defined by Edit Report Style in your custom report that has been explained above.
References
- KoBotoolbox
- KoBoCollect
- Viewing and Creating Custom Reports
- Mapping, Sharing, and Exporting GPS Data
- Export data as CSV and upload to GIS software